
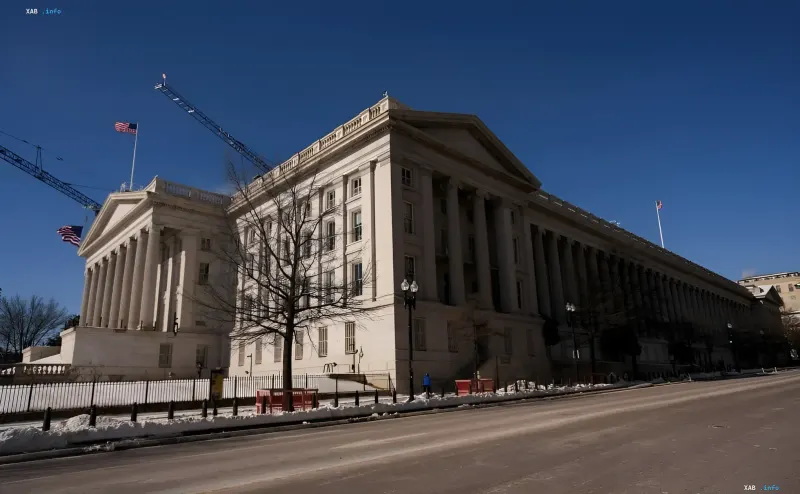
The US Department of Treasury released data on August 18 showing that the volume of US Treasury securities held by China fell from $659.3 billion in May 2026 to $633.4 billion in June 2026. According to the department, this is the lowest level since September 2008 — that is, in nearly 18 years. The $25.9 billion reduction in a single month confirms a sustained, multi-year trend that Beijing has demonstrated since President Donald Trump's first term: amid tensions in bilateral relations, China has been steadily reducing the share of US debt in its foreign-exchange reserve basket.
Context: foreign demand for US debt is also cooling
The reduction in China's position is not an isolated phenomenon. Over the same period, the total volume of US Treasury securities held by foreign investors declined from $9.371 trillion to $9.299 trillion. The largest foreign creditor — Japan — cut its holdings to $1.12 trillion, while the United Kingdom reduced them to $939.9 billion. Thus, Beijing is acting in line with the broader slowdown in foreign demand for US debt, not against it.
Macro backdrop: yields, the Fed, and geopolitics
In June 2026, tensions between the US and Iran intensified, while the market remained uncertain about the direction of the Federal Reserve's monetary policy. Against this backdrop, the yield on long-term US Treasuries recently hit multi-year highs amid concerns over Washington's fiscal sustainability. High yields make holding long Treasuries less attractive for reserve managers, further stimulating asset rotation.
Gold instead of Treasuries: 21 months in a row
In contrast to the trend of declining US bond holdings, China has been steadily building its gold reserves. The People's Bank of China bought gold for the 21st consecutive month — as of July 2026 — bringing total metal reserves to 76.08 million ounces. This parallel dynamic points to structural diversification: Beijing is not simply getting rid of US debt but is reallocating reserves toward "safe" assets that do not depend on US jurisdiction.
Conflicting data
The differences lie primarily in interpretation rather than in the figures themselves. Some analytical outlets (including Ukraine's Minfin) describe the trend as an active "sell-off" of Treasuries by China, emphasizing its signaling effect for the dollar. Other sources interpret the same $25.9 billion monthly decline as a continuation of a gradual, multi-year diversification rather than a one-off sell-off. In addition, the June 2026 data was released with a delay — on August 18 — meaning a two-month lag between the actual period and the disclosure; some earlier publications cited February 2026 data, which sometimes leads to confusion in the chronology. The numerical values ($633.4 billion, a low since September 2008) nonetheless match across all verified sources.